
Household Spending in Malaysia: How Much Malaysians Spend Each Month
What the average Malaysian household spends each month, what it spends it on, how spending differs by state and between town and country, and how fast spending on services is growing. Every figure links to DOSM.
Key Statistics: Household Spending in Malaysia
The headline figures from the Department of Statistics Malaysia’s Household Expenditure Survey 2024.
average monthly household spending in 2024
more a month than in 2022
of household spending now goes on services
a year: how fast spending on services is growing
of spending goes on housing, water, electricity and gas
goes on restaurants and accommodation
average monthly spending in Kuala Lumpur
average monthly spending in Selangor
How Much Does the Average Malaysian Household Spend?
The average Malaysian household spent RM5,566 a month in 2024, up from RM5,150 in 2022, a compound growth rate of 3.9% a year, or RM416 more a month (DOSM, Household Expenditure Survey Report 2024).
What Do Malaysian Households Spend the Most On?
Housing, water, electricity, gas and other fuels take the biggest share, 23.5% or RM1,307 a month. Restaurants and accommodation come next at 17.0% (RM948), a share that rose 0.9 percentage points since 2022 as more households eat out, followed by food and beverages at home (RM876) and transport (11.0%, RM611) (DOSM).
| Spending group | Share of spending | Average a month |
|---|---|---|
| Housing, water, electricity, gas & other fuels | 23.5% | RM1,307 |
| Restaurants & accommodation | 17.0% | RM948 |
| Food & beverages | 15.7% | RM876 |
| Transport | 11.0% | RM611 |
| Information & communication | 6.2% | RM347 |
| Personal care, social protection & miscellaneous | 5.6% | RM313 |
| Furnishings, household equipment & routine household maintenance | 4.7% | RM259 |
| Recreation, sport & culture | 3.2% | RM179 |
| Clothing & footwear | 2.7% | RM151 |
| Health | 2.6% | RM147 |
| Education | 1.4% | RM77 |
Source: Department of Statistics Malaysia, Household Expenditure Survey Report, Malaysia, 2024, published October 2025 (DOSM). Selected groups of the 13 main groups. The food and beverages share is calculated by Service Pro.
Are Malaysians Spending More on Services?
Yes. Services made up 56.7% of household spending in 2024 (RM3,157 a month), up from 54.3% (RM2,797) in 2022, and grew 6.0% a year, compared with just 1.2% a year for goods (DOSM). Households are paying for more of what they used to do themselves, from meals to home upkeep: routine household maintenance, which includes domestic and household services, takes 4.7% of spending (RM259 a month).
Which State Spends the Most?
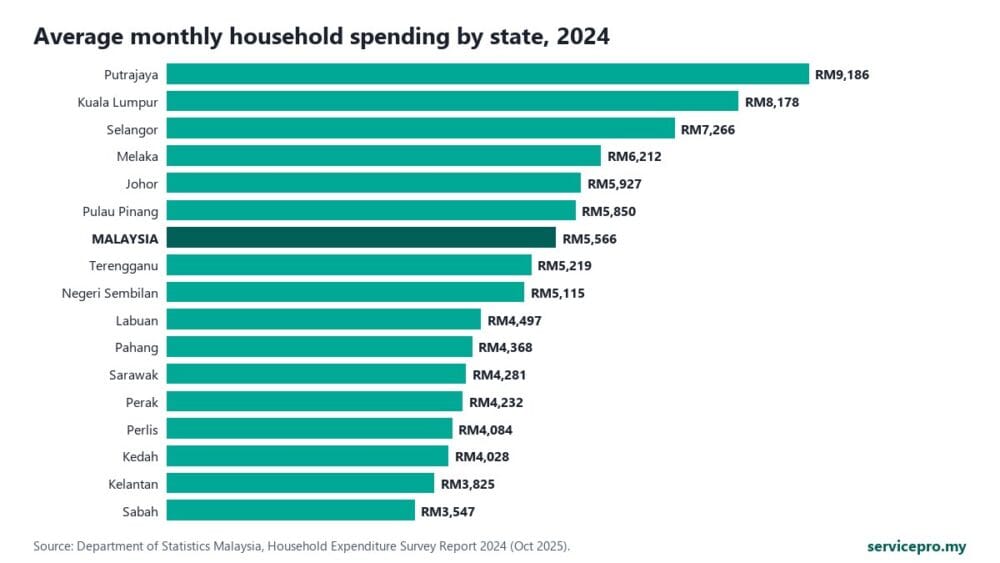
Putrajaya households spend the most at RM9,186 a month, followed by Kuala Lumpur (RM8,178) and Selangor (RM7,266). Sabah spends the least at RM3,547, about 2.6 times less than Putrajaya (DOSM).
How Does Urban Spending Compare With Rural?
Urban households spent RM6,103 a month in 2024 against RM3,750 in rural areas, about 1.6 times more. Rural spending grew faster, at 4.8% a year from RM3,409, than urban spending at 3.6% a year from RM5,675. Urban household income averaged RM10,180, against RM5,636 in rural areas (DOSM).
Paying for Time at Home
The fastest-growing part of the household budget is services, and in the Klang Valley, where households spend the most, the service many families add first is help with the cleaning.
A part-time maid by the hour avoids the recruitment fees and annual permit costs of a live-in helper, and a deep clean for sofas and mattresses covers the jobs a weekly clean does not reach.
Sources and How to Cite This Page
All figures come from the Department of Statistics Malaysia’s Household Expenditure Survey Report, Malaysia, 2024, published in October 2025, which covers household consumption across 13 main groups of goods and services. Differences and ratios are calculated by Service Pro from those figures.
Cite this page: Service Pro, “Household Spending in Malaysia: How Much Malaysians Spend Each Month”, https://servicepro.my/hygiene-insights/household-spending-malaysia-statistics/. Journalists and bloggers are welcome to use these figures, tables and charts with a link to this page.
Short on Time at Home?
Get a Part-Time Maid Without the Live-In Costs
Tell us your area and how often you need help. Service Pro connects you with one verified cleaning partner, and you deal with them directly on WhatsApp.
WhatsApp for a Part-Time Maid