
Haze in Malaysia 2026: Air Quality (API) Statistics
How bad the September 2026 haze got, which areas were worst hit, what each API level means, and how many stations recorded unhealthy air. Every reading links to its source.
Key Statistics: The 2026 Haze
Readings from the Department of Environment’s Air Pollutant Index Management System (APIMS), as reported on the day.
API at Serian, Sarawak on 1 September 2026, in the hazardous range
Sarawak stations at hazardous levels on 1 September 2026
of 68 stations recorded unhealthy air on 18 September 2026
of Malaysia’s monitoring stations unhealthy that morning
API at Johan Setia, Selangor, the worst reading on 18 September
stations recorded good air on 18 September, all in East Malaysia
areas unhealthy on 11 September 2026, 11 of them in Sarawak
the API level above which air is classed as hazardous
What Do the API Levels Mean in Malaysia?
Malaysia’s Air Pollutant Index (API) has five bands: 0 to 50 is good, 51 to 100 moderate, 101 to 200 unhealthy, 201 to 300 very unhealthy, and above 300 hazardous (Department of Environment APIMS via The Star).
| API reading | Status |
|---|---|
| 0 to 50 | Good |
| 51 to 100 | Moderate |
| 101 to 200 | Unhealthy |
| 201 to 300 | Very unhealthy |
| Above 300 | Hazardous |
Source: Department of Environment, Air Pollutant Index Management System (APIMS), via The Star.
How Bad Was the Haze in Malaysia in 2026?
On 1 September 2026, six stations in Sarawak recorded hazardous air, led by Serian at 406. Three more Sarawak stations were very unhealthy (234 to 241), nine stations in Sarawak and Sabah were unhealthy, and no station in Malaysia recorded good air that morning (Department of Environment APIMS via NST).
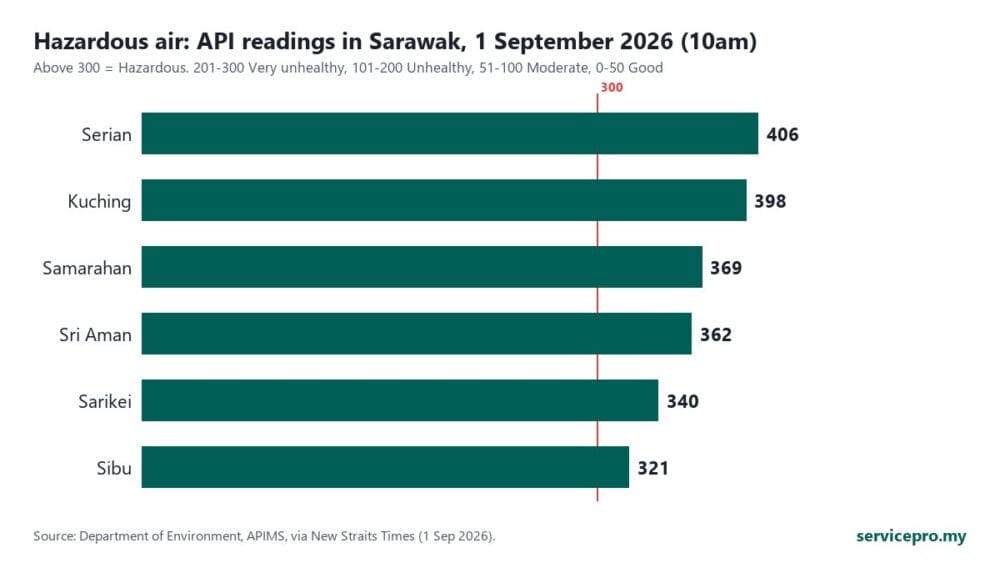
| Station (Sarawak) | Status | API, 1 September 2026 |
|---|---|---|
| Serian | Hazardous | 406 |
| Kuching | Hazardous | 398 |
| Samarahan | Hazardous | 369 |
| Sri Aman | Hazardous | 362 |
| Sarikei | Hazardous | 340 |
| Sibu | Hazardous | 321 |
Source: Department of Environment APIMS, readings at 10am, via New Straits Times.
How Many Areas Had Unhealthy Air During the Haze?
On 18 September 2026, 34 of Malaysia’s 68 monitoring stations recorded unhealthy air, half of the network. Only three stations recorded good air, all in East Malaysia (The Star). A week earlier, on 11 September, 15 areas were unhealthy, 11 of them in Sarawak, which the reports attributed to transboundary haze (The Vibes).
| Date (8am reading) | Worst station | Unhealthy stations |
|---|---|---|
| 11 September 2026 | Serian, Sarawak (195) | 15 |
| 18 September 2026 | Johan Setia, Selangor (198) | 34 of 68 |
Sources: Department of Environment APIMS via The Vibes and The Star.
Which Areas in the Klang Valley Were Worst Hit?
Johan Setia in Selangor recorded Malaysia’s worst air on the morning of 18 September 2026, at 198, two points below the very unhealthy band. Nilai (181), Seri Manjung (176) and Putrajaya (173) were also among the worst readings that morning, alongside Kuching (192) and Samarahan (184) in Sarawak (The Star).
Does Haze Affect Electricity Bills?
Yes, indirectly. On 16 September 2026 the Prime Minister said haze and hotter weather had driven up household electricity consumption, as homes kept windows shut and air-conditioners running (The Vibes). See our electricity tariff statistics for how bills are calculated.
Cleaning Up After the Haze
Weeks of haze leave fine dust on every surface a home has, and the air-conditioner, sofa and mattress hold on to it long after the sky clears.
A filter clean for the aircond and a deep clean for soft furnishings are the two jobs that a normal weekly clean does not reach.
Sources and How to Cite This Page
All readings come from the Department of Environment’s Air Pollutant Index Management System (APIMS), as reported by the outlets linked on the day they were taken. Readings change hourly, so each figure is shown with its date and time. The share of unhealthy stations is calculated by Service Pro.
Cite this page: Service Pro, “Haze in Malaysia 2026: Air Quality (API) Statistics”, https://servicepro.my/hygiene-insights/haze-air-quality-malaysia-statistics/. Journalists and bloggers are welcome to use these figures, tables and charts with a link to this page.
Dust Everywhere After the Haze?
Book a Deep Clean for Sofas and Mattresses
Tell us what needs cleaning and where you are. Service Pro connects you with one verified cleaning partner, and you deal with them directly on WhatsApp.
WhatsApp About a Deep Clean